When thinking about the founding of the Maine State Seminary, it is easy to assume that financial support for the institution came entirely from wealthy residents of New England’s largest cities – the Benjamin Bateses of the region. However, analysis of the 1855-1857 donation ledgers reveals that this is not necessarily the truth.
Chi-Squared Tests: Distribution of Donations
The first question to ask of this data is whether there is a statistically significant difference in the distribution of amounts between donations from Maine and donations from outside of Maine. To answer this question, we can perform a chi-squared test of independence.
To prepare the data for a chi-squared test, we must create a table of counts, separating the donations into categories based on amounts and whether or not they came from Maine:
# make table of counts --> bin values into <$5, 5-10, 10-20, 20+


dist_table <- as.data.frame(matrix(data = c(0,0,0,0,0,0,0,0), nrow = 2, ncol = 4))
colnames(dist_table) <- c("<5", "5-10", "10-20", "20+")
rownames(dist_table) <- c("Maine", "Not Maine")

# create counts
for(i in 1:nrow(mss_donors)){
  if(mss_donors$is_not_maine[i] == 0) {
    current_amt <- mss_donors$Amount[i]
  if(current_amt < 5){
   dist_table[1,1] <- dist_table[1,1]+1
} else if(current_amt >= 5 & current_amt < 10) {
   dist_table[1,2] <- dist_table[1,2]+1
} else if(current_amt <= 10 & current_amt <20) {
   dist_table[1,3] <- dist_table[1,3]+1
} else if(current_amt >= 20){
   dist_table[1,4] <- dist_table[1,4]+1
}
}
if(mss_donors$is_not_maine[i] == 1) {
current_amt <- mss_donors$Amount[i]
 if(current_amt < 5){
   dist_table[2,1] <- dist_table[2,1]+1
} else if(current_amt >= 5 & current_amt < 10) {
   dist_table[2,2] <- dist_table[2,2]+1
} else if(current_amt <= 10 & current_amt <20) {
   dist_table[2,3] <- dist_table[2,3]+1
} else if(current_amt >= 20){
   dist_table[2,4] <- dist_table[2,4]+1
}
}
}

# perform chi-squared test
chisq.test(dist_table)
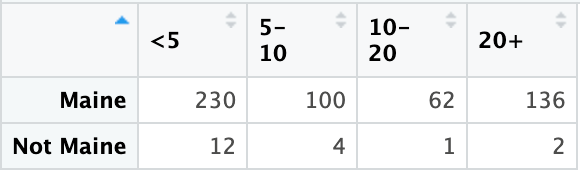
The resulting distribution table.
Results of the Chi-squared test.
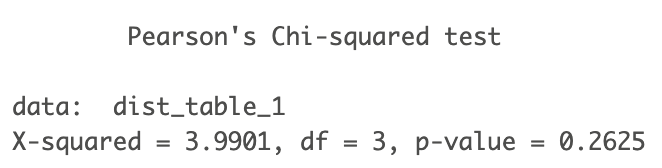
The Chi-square test resulted in a p-value of 0.2625, indicating that there is a 26% likelihood that the differences in these two distributions are due to randomness. Thus, there is not likely a statistically significant difference in distribution between donations from Maine and donations from outside of Maine.
But what about within Maine? The Chi-squared test can be repeated, this time grouping the donations by county.
# making a vector of county names
maine_counties <- c("Androscoggin", "Aroostook", "Cumberland", "Franklin", "Hancock", "Kennebec", "Knox", "Lincoln", "Oxford", "Penobscot", "Piscataquis",
 "Sagadahoc", "Somerset", "Waldo", "Washington", "York")

# removing rows where Amount is NA
mss_donors_maine <- mss_donors_maine[is.na(mss_donors_maine$Amount) == FALSE,]

# creating a new distribution table with the same bins as before

dist_table <- as.data.frame(matrix(nrow = 16, ncol = 4, data = 0))
colnames(dist_table) <- c("<5", "5-10", "10-20", "20+")
rownames(dist_table) <- maine_counties

# creating counts

for(i in 1:16){

county <- maine_counties[i]

for(j in 1:nrow(mss_donors_maine)){

  current_amt <- mss_donors_maine$Amount[j]

  if(mss_donors_maine$county[j] == county){

    if(current_amt < 5){

      dist_table[i,1] <- dist_table[i,1]+1

    } else if(current_amt >= 5 & current_amt < 10) {

      dist_table[i,2] <- dist_table[i,2]+1

    } else if(current_amt <= 10 & current_amt <20) {

      dist_table[i,3] <- dist_table[i,3]+1

    } else if(current_amt >= 20){

      dist_table[i,4] <- dist_table[i,4]+1
    }
}
}
}


# getting rid of all rows with zeroes
dist_table_revised <- dist_table[dist_table$'<5' != 0 & dist_table$'5-10' != 0 & dist_table$'10-20' != 0 & dist_table$'20+' != 0,]

# running the chi-squared test
chisq.test(dist_table_revised)
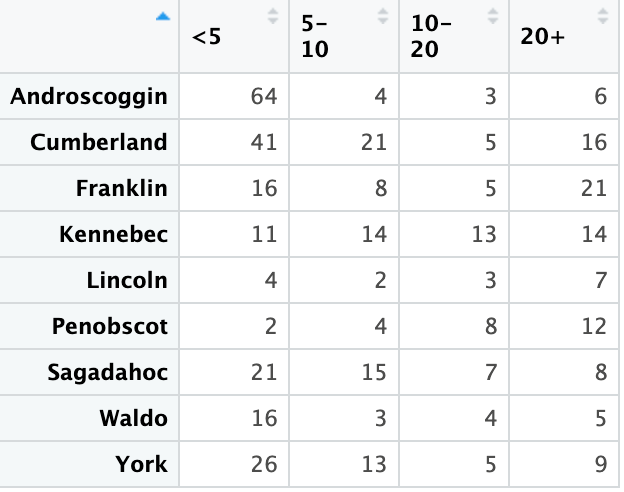
County distribution table with all zeroes removed.
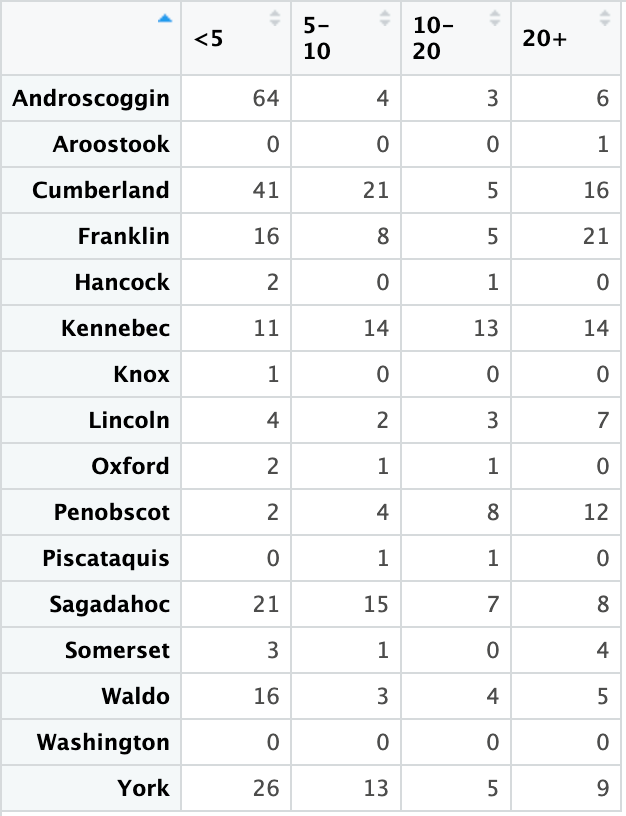
County distribution table with zeroes.

Results of the Chi-squared test.
This Chi-squared test produced a very small p-value, indicating that there is very little chance that the differences in donation distribution between counties is due to random variation.
Map: What counties donate the most?
After establishing that there are meaningful differences in donation amounts between counties, the obvious next step is to investigate these differences.
Using the data frame county_data_merged, the production of which is documented on the page Data Preparation, we can produce a map in which each county is shaded according to its total donation amount to the Maine State Seminary.
It is important to note that the counties of Maine were still in flux during the 1850s and 1860s. Three counties – Androscoggin, Knox, and Sagadahoc – did not yet exist at the time of the 1850 Federal Census. I have sorted the towns and cities of Maine into their modern county associations for ease of comparison.
county_map <- ggplot(county_data_merged) +

             geom_sf(aes(fill = total)) +

             scale_fill_gradient(low =
             "#edf8e9", high = "#006d2c") +

             theme_minimal() +

             labs(title = "Total Donation
                            by County",
                  fill = "Total")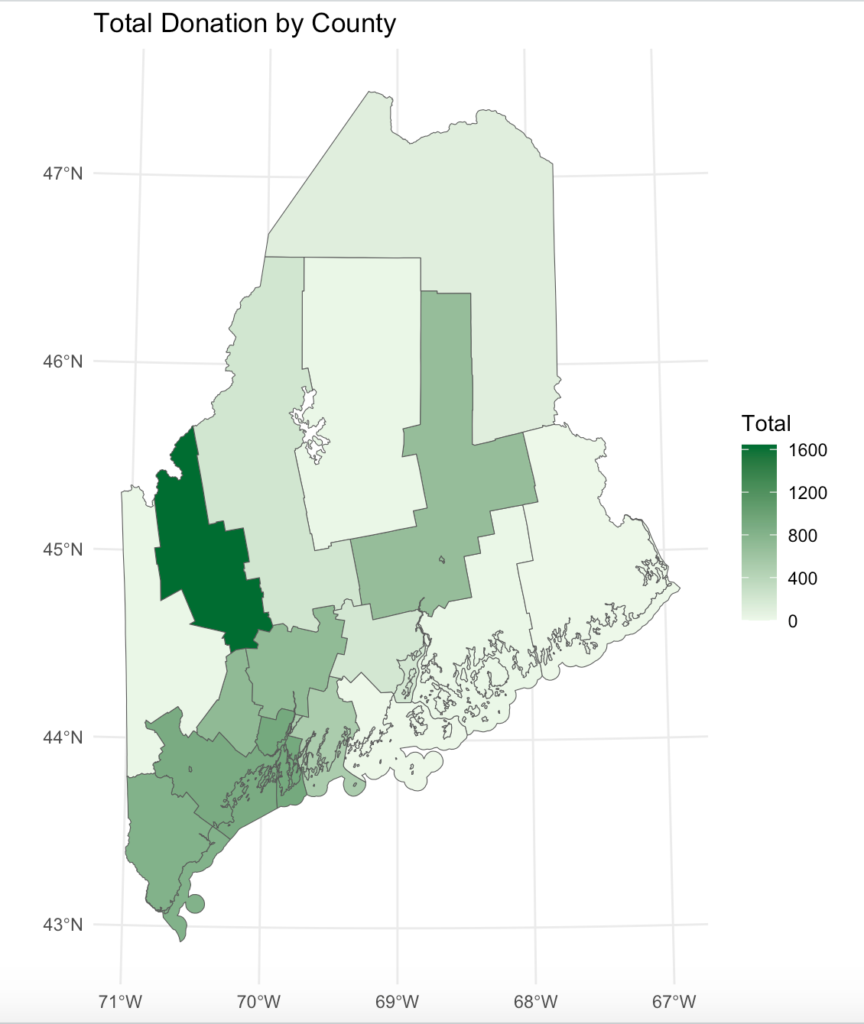
This map produces a surprising result: the county with the highest total donation is not Androscoggin, where the Maine State Seminary was located, nor is it Cumberland, which is home to Portland. It is instead Franklin county, which had a population of roughly 20,000 in the 1850 census, making it the third smallest county in Maine at the time (US Census Bureau). Farmington was Franklin county’s largest city at the time, with a population of just under 3,000; in comparison, Lewiston had about 3,500 residents, and Portland had a population of just over 20,000.
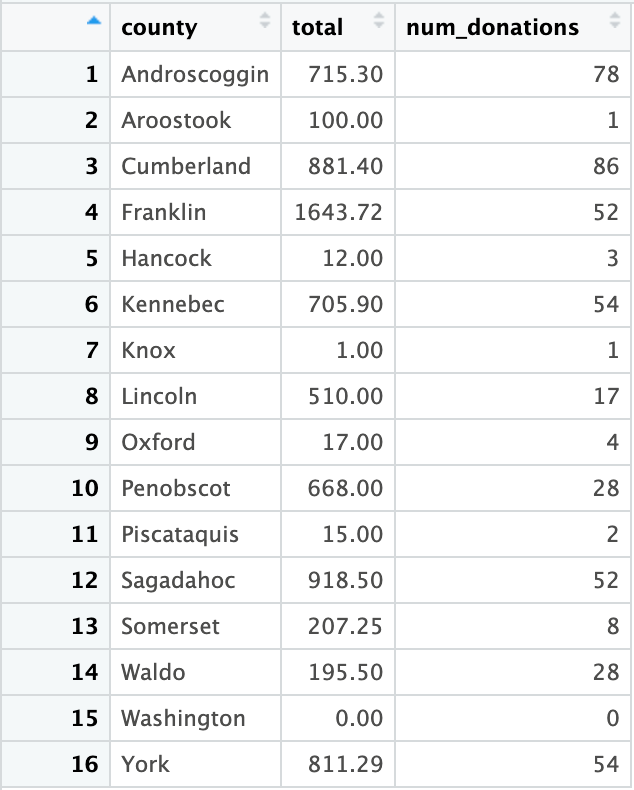
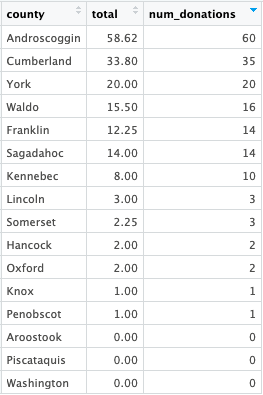
Interestingly, Franklin county does not have the highest number of individual donations. Cumberland and Androscoggin counties had far more donations, but still had lower totals than Franklin. This indicates that Franklin county must have contributed relatively fewer, but larger donations. In fact, six of the 22 donations of $100 or higher came from Franklin county. In contrast, Androscoggin had the highest share of donations of $1 or less.
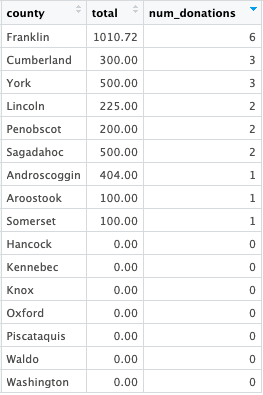
Total sum and count of donations over $100 for each county.
Total sum and count of donations of $1 or less for each county.
Where exactly was all this Franklin county money coming from? The data indicate that the source of much of Franklin county’s donations were a few wealthy people donating in large increments. One of these individuals Thomas Parker, a resident of Farmington, who gave a total of $500. According to the 1850 Census, Parker was a mason. Parker became the namesake of Parker Hall, the college’s first dormitory (“History of Bates Campus Buildings”). William Toothaker of Phillips, who is listed in the 1850 Census as a farmer with $4700 worth of real estate, contributed over $300 in 1857, making him one of the largest individual donors in the treasurer’s ledger.
It is perplexing why certain donors are commemorated, while others have completely disappeared from the collective Bates memory. Seth Hathorn and Thomas Parker became the namesakes of some of the most iconic buildings on the Bates campus, while our farmer William Toothaker has been completely forgotten. We remember the generosity of Lewiston during the founding of the college, but have completely overlooked the role of Franklin county in our founding. As we work to tell a more complete story of our history, we should include these overlooked aspects.